On this page
Take a toy AI server that is handling 17 requests a second. A request takes 0.74 seconds (s) on average, yet 1 request in 20 takes more than 2.36 s and 1 in 100 more than 3.46 s. People feel the slow ones, and the average hides them. This lesson shows why, using a simulation that runs inside one Python program and uses no network, and what to report instead.
In one minute
Picture 10 shoppers at a checkout. Eight wait 1 minute and two wait 16, so the average is 4 minutes. Nobody waited 4 minutes: eight waited far less and two far more. A few slow cases pull the average up, yet it stays far below what the slowest meet.
A percentile fixes this. Sort every wait from shortest to longest. The p50 is the middle one, the typical wait. The p95 is the wait that 95 of every 100 requests beat, so 1 in 20 is slower. The p99 is the wait that 99 in 100 beat, so 1 in 100 is slower. Report all three, worked out from every request, and report the wait before the first word (lesson 23) apart from the total time, from send to last word.
Explore the numbers
Open the widget. It sends 2,000 invented requests to a toy server with 8 slots, the places that serve requests at the same moment (lesson 24). Drag the load from 4 to 19 requests a second; this server tops out near 19.7. The curve is every request’s time, fastest to slowest, with the average as a dashed line and p50, p95 and p99 as dots. The buttons switch between total time, from send to last word, and the wait before the first word, called time to first token. At the opening 17 a second, the total time averages 0.74 s, but p95 is 2.36 s and p99 is 3.46 s. Under More settings you can freeze the server for 5 s and change how the tester sends. It is a toy at a chip’s peak speed, not a real service.
How it works
Many fast, a few slow
At 17 requests a second, 1,355 of the 2,000 requests take the average of 0.74 s or less and 645 take longer. In Figure 1 most requests sit on the low, flat part of the curve and the last few shoot up. That thin end is the tail, and the long waits in it are tail latency. Replies explain part of it: 217 of the 2,000 are long, 100 tokens or more, against at most 60 for the rest, and a long reply holds its slot. Waiting in line for a slot adds more as the load grows.
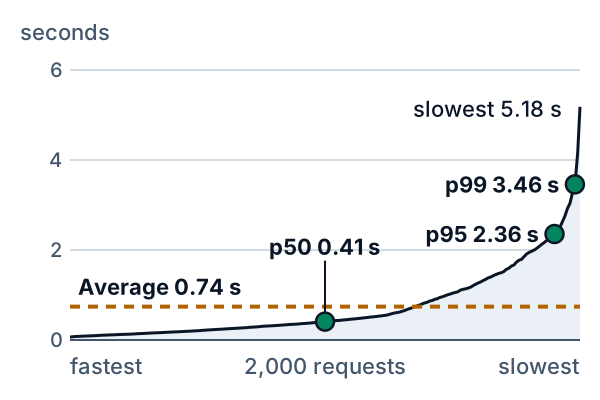
Figure 1. Every request’s total time. The dashed line is the average; green dots mark p50, p95 and p99.
At every load the order is the same: p50 below the average, the average below p95, p95 below p99. The average is pulled above the typical request and stays far below the tail.
Load widens the gap
Figure 2 shows the wait before the first word; the gap between the average and the tail, in seconds, grows with load. At 12 requests a second the average is 0.059 s, p95 is 0.39 s and p99 is 0.73 s. At 19 the average is 1.06 s and p99 is 4.04 s. From 4 to 12 a second the p50 wait barely moves, from 0.014 to 0.016 s, while the p99 rises from 0.036 to 0.73 s. The tail moves first, and an average of 0.059 s looks healthy while 1 request in 20 already waits more than 0.39 s.
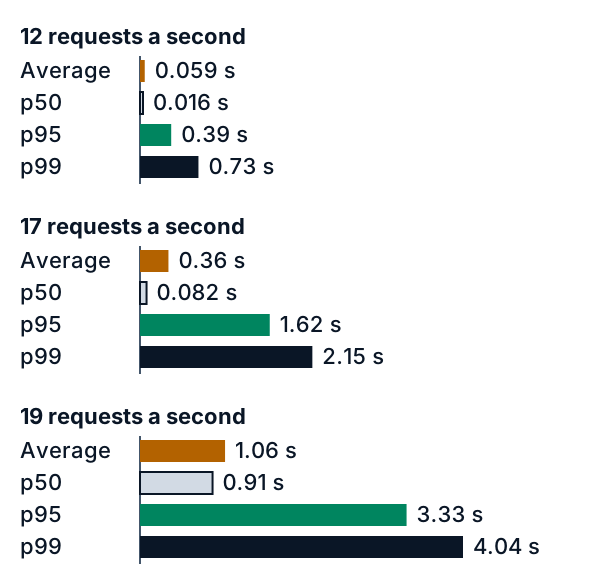
Figure 2. Wait before the first word. Orange is the average, the outlined bar p50, green p95 and the dark bar p99.
One user, many requests
A chat sends many requests, and a rare slow one becomes common for the person. If 1 request in 20 is slower than p95, a session of 10 requests meets at least one with chance 1 minus 0.95 to the power 10, which is 40%. For a session of 20 it is 64%. This assumes each wait is independent of the others.
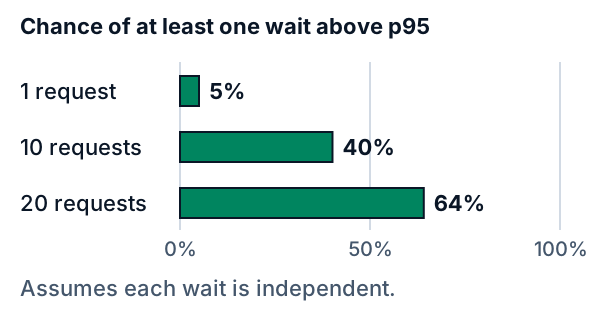
Figure 3. The chance that a session meets at least one wait above p95.
What this means when you build
- Report p50, p95 and p99, not the average alone. At 17 a second the average is 0.74 s and the p99 is 3.46 s.
- Report the wait before the first word apart from the total time. At 17 a second the average wait is 0.36 s and the p99 wait is 2.15 s, against 0.74 s and 3.46 s for the total.
- Set targets as percentiles. “Average under 1 s” passes at 0.74 s while 1 request in 20 takes over 2.36 s. “p95 under 2 s” fails there, and it says how many may be slow: 1 in 20.
- Measure at and above the expected load. The p99 wait is 0.036 s at 4 a second and 4.04 s at 19. Include the cases you expect, such as prompts that hit a cache (see the lesson on prompt caching) and users who reach a usage limit (see the lesson on usage limits), since either can change the waits. Test your own service, in a test setting, within its limits.
- If your users arrive on their own, each when they please, send test requests on a schedule, not one after another. A tester that waits for each reply sends less while the server is stuck, so it misses the slow requests, a flaw called coordinated omission. In the toy, with a 5 s freeze, the p99 wait is 4.23 s for a tester on schedule and 0.040 s for one that waits.
- Keep every sample, or a histogram you can merge. Two servers’ p99 waits of 0.036 s and 4.04 s average to 2.04 s, but all 4,000 requests together have a p99 of 3.75 s. Percentiles cannot be averaged.
- When a provider quotes one speed number, ask which percentile, which measure and at what load, and how the test sent its requests (on a schedule, or one after another).
Optionalabout 14 min
Go deeper
Optional. This part is for readers who write Python. The code is in the code/ folder next to this lesson. From inside that folder, python3 show_numbers.py prints every number in this lesson, and PYTHONDONTWRITEBYTECODE=1 python3 -m pytest -q -p no:cacheprovider runs the tests. Nothing in it sends a request over a network: the tester and the server are two parts of one program.
How a percentile is computed
A percentile is read from a sorted list. The nearest-rank rule takes the value at rank ceil(p x n / 100) among n sorted times, counting from 1:
def percentile(values, p):
    ordered = sorted(values)
    return ordered[-(-p * len(ordered) // 100) - 1]
The expression -(-a // b) rounds a / b up, and 1 is taken off because Python counts from 0. For 2,000 times, p99 is the 1,980th, so 20 times are slower. How many times lie above depends on how many samples there are. In the table, Rank is the position of the p99 and Slower is the number of times above it:
| Requests | Rank | Slower |
|---|---|---|
| 50 | 50 | 0 |
| 100 | 99 | 1 |
| 200 | 198 | 2 |
| 1,000 | 990 | 10 |
| 2,000 | 1,980 | 20 |
From 50 requests the p99 is just the slowest one, and from 100 it is the second slowest, so one odd request sets it. A p99 with more than one request above it needs at least 200 requests. Other tools use other rules. numpy.percentile interpolates between neighbouring values by default, so for the numbers 1 to 50 its p99 is 49.51 where nearest rank gives 50; with method="inverted_cdf" it gives nearest rank. On this lesson’s 2,000 times the default differs by less than a thousandth of a second. A report should say which rule it uses.
The load sweep
The toy sends the same 2,000 requests at every load, one seeded draw (seed 2027) with prompts of 30 to 599 tokens and replies of 8 to 396. A load only scales the gaps between sends. The server is lesson 24’s continuous batching with 8 slots, rewritten in tail_sim.py as serve so that it can freeze and can send in two ways; a test checks that on a schedule it gives that lesson’s times for every request. It can finish at most 19.7 requests a second, so the loads stop at 19. Total time is the last word minus the send time, and the wait is the first word minus the send time. Load is the number of requests sent a second, and the tables give seconds. Running show_numbers.py prints the p50, the p95 and the slowest time as well.
| Load | Average | p99 |
|---|---|---|
| 4 | 0.38 | 2.80 |
| 8 | 0.39 | 2.85 |
| 12 | 0.44 | 3.02 |
| 15 | 0.53 | 3.21 |
| 17 | 0.74 | 3.46 |
| 19 | 1.45 | 4.81 |
| Load | Average | p99 |
|---|---|---|
| 4 | 0.016 | 0.036 |
| 8 | 0.020 | 0.12 |
| 12 | 0.059 | 0.73 |
| 15 | 0.15 | 1.22 |
| 17 | 0.36 | 2.15 |
| 19 | 1.06 | 4.04 |
The first table is total time and the second the wait before the first word. The total-time tail is long even at 4 a second, a p99 of 2.80 s, because the long replies take that long to write. The wait before the first word is the one that load changes.
These numbers belong to one order of requests. The widget’s Shuffle button reorders the prompts, replies and gaps, and over its 8 orders at 17 a second the average total time runs from 0.62 to 0.78 s and the p99 from 3.20 to 3.55 s. One run is a sample, so repeat it and report the spread.
The chance a session meets a slow request
If a share s of requests is slower than some cutoff and each wait is independent of the others, the chance that a session of k requests meets at least one slow request is 1 - (1 - s)^k, because (1 - s)^k is the chance of missing them all. With s = 0.05, the share above p95, the chance is 5% for 1 request, 40.1% for 10 and 64.2% for 20. Adding shares to get 50% for 10 requests would count sessions with two slow requests twice.
The same arithmetic is used across servers: if each of 100 servers is slower than the cutoff for 1 request in 100, a request that waits for all 100 is slower with chance 1 - 0.99^100, which is 63.4%. Independence is an assumption. A busy minute slows many requests in a row, so for a real service this chance is a rough guide.
Two ways to send test requests
A tester that sends on a schedule sends each request at its planned time, whatever the server is doing. A tester that waits for each reply keeps a fixed number of connections, here 8, and each sends its next request when its last reply is complete, or at the planned time if that is later. Real tools offer both. Compare them on one server with one fault: at 12 requests a second, well below its limit, the server freezes for 5 s at 40 s. The table gives how many requests each tester sends during the freeze, and its p99 wait. Waiting is the tester that waits for each reply.
| Tester | Sent | p99 wait |
|---|---|---|
| On schedule | 58 | 4.23 s |
| Waiting | 2 | 0.040 s |
When the server freezes, the connections of the waiting tester all wait for replies that do not come, so it stops sending, and when the freeze ends it sends the requests it held back in a rush. Only 2 requests go out in the freeze instead of 58. Even with no freeze, 772 of its 2,000 requests go out later than planned, because the last reply on their connection is not yet complete at the planned time; the freeze adds 107, so 879 in all. It records almost no slow waits: 2 of its requests wait over 1 s for the first word, against 178 for the tester on schedule, and its p99 is 0.040 s. Its one worst wait, 5.01 s, shows the freeze, but a p99 over 2,000 requests ignores the worst 20. It also never has more than 8 requests out, so it never queues the way people who arrive on their own do.
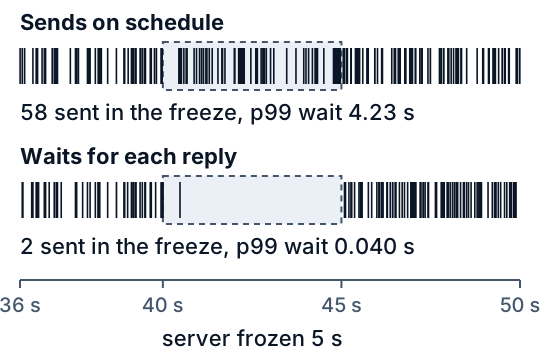
Figure 4. When each tester sent its requests. The dashed box is the 5 s freeze.
This flaw is called coordinated omission: the tester coordinates with the server, and omits the measurements it should have taken while the server is slow. A tester can time each request from its planned send time, not its actual one, so that the tester’s own delay counts as waiting. This lesson’s code does not compute that and gives no numbers for it.
Averaging percentiles
Take two servers that handled the same 2,000 requests, one at a quiet 4 a second and one at a busy 19. Their p99 waits are 0.0360 s and 4.0375 s, and the average of the two is 2.0367 s. Pool all 4,000 waits and the p99 is 3.7473 s. The 40 slowest of the 4,000 all come from the busy server, so the pooled answer sits near its tail, and the averaged 2.04 s matches neither server. To combine servers, compute the percentile from all the samples, or keep a histogram, a count of requests in each band of time. Counts from many servers add up, and the percentile can be read from the sum to within the width of a band.
What the toy leaves out
Real clients may retry a slow request, which adds load just when the server is slow. A request that gathers answers from many servers is as slow as the slowest of them. Network time between the person and the server is not here, and neither are the memory limits lesson 24 mentions. The load is steady, with gaps drawn once and scaled, whereas real traffic rises and falls, and a quiet hour’s p99 says little about a busy one. The server’s step times are lesson 24’s best case at a chip’s peak speed, so the seconds are not those of a real service. The shape, though, is what matters: the average sits low, the tail sits high, and the gap in seconds grows with load.
Proof it works
test_tail_sim.py pins the numbers above. On a schedule, the toy must give lesson 24’s times for every request at three loads. The percentile function must give the 1,980th of 2,000 with 20 slower, the slowest of 50, and the same values as NumPy’s inverted_cdf. At every load p50 < average < p95 < p99 < slowest for both measures. The session chance must equal one minus the product of the misses. The waiting tester must never send early, never have more than 8 requests out, and must show a p99 more than 100 times lower than the tester on schedule. The averaged p99 must stay under 0.6 of the pooled one. A last test reads this page and the four figures and checks that each number they quote is the one the code gives. test_widget.py runs the widget’s JavaScript in Node against the Python over 38 settings, and drives the page through a small stand-in for the browser.
Where this is used in practice
The Tail at Scale (Dean and Barroso, Communications of the ACM, February 2013) says that rare slow replies affect a significant fraction of requests in large systems and that layers of queueing amplify the variability. Its example is a server with a typical reply of 10 ms and a p99 of 1 s; a request that needs 100 such servers in parallel is, it says, slower than 1 s for 63% of user requests. The Google SRE book’s chapter on service level objectives (Jones, Wilkes and Murphy with Smith, page copyright 2017 Google) says that averaging request times “obscures an important detail”, that most metrics are better thought of as distributions, and that a high percentile shows a plausible worst case while the p50 shows the typical one. It gives an example in which a typical request takes about 50 ms while 5% take 20 times longer, and says that watching only the average would show no change over a day in which the tail changed a lot. It also says that the effect of high variance is made worse at high load by queueing.
The wrk2 README (Tene, undated) says that wrk, which sends the next request on a connection only after a reply, shows a strong coordinated omission effect, and that wrk2 measures from the time a request should have been sent at the configured constant rate. The vLLM project’s benchmark documentation defines time to first token as the time from sending a request to receiving its first streamed output, notes that metric names are not standardized across benchmarking tools, and describes an option that reports the time requests spend waiting for the benchmark client’s own limit on concurrent requests. All of these were read on 2026-10-19. The figures in this lesson are the toy’s, not theirs.
Skills this lesson builds
- Explain why the average hides the slow requests, and say what to report instead.
- Read p50, p95 and p99 from a sorted list, and say how many requests a p99 needs.
- Work out the chance that a session meets at least one slow request.
- Tell a tester that sends on a schedule from one that waits for each reply, and say what the second misses.
- Say why percentiles from different servers cannot be averaged.
Portfolio project: write a small simulation of your own, entirely inside one program, with invented request times and a server that serves a few at a time. Compute the average, p50, p95 and p99 at a light and a heavy load, then add a freeze and compare a tester that sends on a schedule with one that waits for each reply. Publish the code, one chart and a note on where your results differ from this lesson’s.
Check yourself
-
Ten shoppers wait: eight for 1 minute and two for 16. What are the average and the p50?
Answer
The average is (8 x 1 + 2 x 16) / 10 = 4 minutes. The p50 is the middle wait, the 5th of 10 sorted, which is 1 minute. The average matches nobody’s wait.
-
At 17 requests a second the total time averages 0.74 s and p95 is 2.36 s. How many of the 2,000 requests take longer than p95, and what does that mean for a session of 20?
Answer
100 requests, 1 in 20. A session of 20 meets at least one of them with chance 1 minus 0.95 to the power 20, about 64% (Figure 3), if the waits are independent.
-
Two servers have p99 waits of 0.036 s and 4.04 s. Is the p99 of the two together 2.04 s?
Answer
No. The average of two percentiles is not a percentile of the pooled requests. In the toy, the pooled p99 of 4,000 requests is 3.75 s, because the 40 slowest all come from the busy server. Compute it from all the samples or from a merged histogram.
-
During a 5 s freeze, one tester reports a p99 wait of 4.23 s and another 0.040 s. Which is right, and why do they differ?
Answer
The 4.23 s of the tester that sends on a schedule shows what people sending during the freeze meet: 58 requests went out. The tester that waits for each reply sent only 2 in the freeze, so it recorded almost no slow waits. Its worst wait, 5.01 s, still shows the freeze.
-
Why is a p99 from 50 requests just the slowest request?
Answer
By nearest rank the p99 of 50 sorted times is the one at rank ceil(0.99 x 50) = 50, the last. Nothing lies above it. From 200 requests the p99 has 2 requests above it.
Further reading
Gentle
- Why does an AI wait a moment before the first word? (lesson 23, the wait this lesson measures)
- How does an AI server answer many people at once? (lesson 24, the server behind the toy)
- Service Level Objectives (Jones, Wilkes and Murphy with Smith, chapter 4 of Site Reliability Engineering, O’Reilly Media, page copyright 2017 Google; read 2026-10-19)
Deep
- The Tail at Scale (Dean and Barroso, Communications of the ACM 56(2), pp. 74-80, February 2013), and the authors’ copy, read 2026-10-19
- wrk2 README (Tene, GitHub, undated; read 2026-10-19)
- vLLM benchmark CLI (vLLM project documentation; read 2026-10-19)
Optional
Code
Each file runs on its own. Download it, or read it here.
Show code
"""Keep the copy of the model, the chip and the 2,000 invented requests inside ../widget.html equal to the ones in tail_sim.py.

    python3 embed_widget.py          rewrite the data block in widget.html
    python3 embed_widget.py --check  exit 1 if widget.html differs (test_widget.py runs the same check)
"""
import json
import re
import sys
from pathlib import Path

import tail_sim as sim

WIDGET = Path(__file__).resolve().parent.parent / "widget.html"
CONFIG_BLOCK = re.compile(r'(<script type="application/json" id="tl-config">)(.*?)(</script>)', re.S)
OPENING = {"rate": sim.OPENING_RATE, "measure": "total"}


def config():
    """What the page needs to run the same toy server and tester: the model, the chip, the drawn requests and the settings it offers."""
    b = sim.batching
    return {
        "params": b.PARAMS, "bytesPerWeight": b.FP16_BYTES, "kvBytes": b.KV_BYTES_PER_TOKEN, "peak": b.A100_PEAK_FLOPS, "bandwidth": b.A100_BANDWIDTH,
        "slots": sim.SLOTS, "gaps": sim.WORKLOAD["gaps"], "prompts": sim.WORKLOAD["prompts"], "replies": sim.WORKLOAD["replies"],
        "rates": sim.RATES, "capacity": round(sim.capacity(), 1), "connections": sim.CONNECTIONS, "pauseAt": sim.PAUSE_AT, "pause": sim.PAUSE,
        "rerolls": sim.REROLLS, "opening": OPENING,
    }


def embed(html):
    """html with the data block rewritten from tail_sim.py."""
    settings = json.dumps(config(), ensure_ascii=False, separators=(", ", ": "))
    return CONFIG_BLOCK.sub(lambda m: m.group(1) + "\n" + settings + "\n" + m.group(3), html, count=1)


if __name__ == "__main__":
    current = WIDGET.read_text(encoding="utf-8")
    updated = embed(current)
    if "--check" in sys.argv:
        sys.exit(0 if updated == current else 1)
    WIDGET.write_text(updated, encoding="utf-8")
print("widget.html data block now matches tail_sim.py")Show code
"""Draw the four figures of lesson 27 from tail_sim.py, so that no number in a figure is typed by hand.

    python3 make_figs.py          rewrite ../figs/*.svg
    python3 make_figs.py --check  exit 1 if a figure on disk differs (test_tail_sim.py runs the same check)

Figures 1 to 3 are 600 units wide and figure 4, which sits in Go deeper, 540. Text is at least 22 units (20 for axis ticks) in ink or grey on
white or a light fill; orange and green are used on marks only.
"""
import sys
from pathlib import Path
from xml.sax.saxutils import escape

import tail_sim as sim

FIGS = Path(__file__).resolve().parent.parent / "figs"
INK, GREY, ORANGE, GREEN, FILL, PANEL = "#0a1626", "#44566b", "#b36200", "#00855F", "#d2dae4", "#ebf0f6"
DASH = "10 8"


def num(x: float) -> str:
    return f"{x:.2f}".rstrip("0").rstrip(".")


# The SVG namespace is a name that every standalone .svg file must carry, not an address this program visits. It is written in two pieces so that a plain
# search of code/ for the start of a web address finds nothing (test_tail_sim.py runs that search).
NAMESPACE = "ht" + "tp://www.w3.org/2000/svg"


def frame(width: int, height: int, title: str, desc: str, body: list[str]) -> str:
    head = (f'<svg xmlns="{NAMESPACE}" viewBox="0 0 {width} {height}" width="{width}" height="{height}" role="img" '
            f'font-family="system-ui, sans-serif" font-size="22" fill="{GREY}">')
    return "\n".join([head, f"  <title>{escape(title)}</title>", f"  <desc>{escape(desc)}</desc>", '  <rect width="100%" height="100%" fill="#ffffff"/>',
                      *("  " + line for line in body), "</svg>", ""])


def text(x: float, y: float, content: str, anchor: str = "start", color: str = INK, bold: bool = False, size: int = 22) -> str:
    extra = (f' text-anchor="{anchor}"' if anchor != "start" else "") + (' font-weight="bold"' if bold else "") + (f' font-size="{size}"' if size != 22 else "")
    return f'<text x="{num(x)}" y="{num(y)}"{extra} fill="{color}">{escape(content)}</text>'


# --- figure 1: the sorted total times at the opening load ---------------------------------------------------------------------

def fig_sorted() -> str:
    rate = sim.OPENING_RATE
    times = sorted(sim.totals(sim.serve(sim.WORKLOAD, rate)))
    stats = sim.summarize(times)
    n = len(times)
    x0, x1, top, base, ymax = 70, 580, 70, 340, 6.0
    px = lambda share: x0 + share * (x1 - x0)
    py = lambda seconds: base - seconds / ymax * (base - top)
    points = [(px(i / (n - 1)), py(times[i])) for i in range(0, n, 10)] + [(px(1.0), py(times[-1]))]
    curve = "M" + " L".join(f"{num(x)} {num(y)}" for x, y in points)
    body = [text(20, 40, "seconds", color=GREY)]
    for tick in (0, 2, 4, 6):
        body.append(f'<path d="M{x0} {num(py(tick))}H{x1}" stroke="{FILL}" stroke-width="2"/>')
        body.append(text(x0 - 8, py(tick) + 7, str(tick), "end", GREY, size=20))
    body.append(f'<path d="{curve}V{base}H{x0}Z" fill="{PANEL}" stroke="none"/>')
    body.append(f'<path d="{curve}" fill="none" stroke="{INK}" stroke-width="3"/>')
    avg_y = py(stats["average"])
    body.append(f'<path d="M{x0} {num(avg_y)}H{x1}" stroke="{ORANGE}" stroke-width="4" stroke-dasharray="{DASH}"/>')
    body.append(text(x0 + 8, avg_y - 12, f"Average {sim.seconds_text(stats['average'])} s", bold=True))
    marks = {"p50": 0.50, "p95": 0.95, "p99": 0.99}
    for name, share in marks.items():
        x, y = px(share), py(stats[name])
        label = f"{name} {sim.seconds_text(stats[name])} s"
        if name == "p50":
            body.append(f'<path d="M{num(x)} {num(y - 8)}V{num(avg_y - 46)}" stroke="{INK}" stroke-width="2"/>')
            body.append(text(x, avg_y - 52, label, "middle", bold=True))
        else:
            body.append(text(x - 16, y + 8, label, "end", bold=True))
        body.append(f'<circle cx="{num(x)}" cy="{num(y)}" r="9" fill="{GREEN}" stroke="{INK}" stroke-width="2.5"/>')
    body.append(text(px(0.99) - 14, py(stats["max"]) + 10, f"slowest {sim.seconds_text(stats['max'])} s", "end"))
    body.append(f'<path d="M{x0} {base}H{x1}" stroke="{GREY}" stroke-width="2"/>')
    body.append(text(x0, base + 34, "fastest", color=GREY))
    body.append(text((x0 + x1) / 2, base + 34, f"{n:,} requests", "middle", GREY))
    body.append(text(x1, base + 34, "slowest", "end", GREY))
    shown = ", ".join(f"{name} {sim.seconds_text(stats[name])} s" for name in marks)
    desc = (f"The {n:,} total times at {rate} requests a second, sorted from fastest to slowest. The curve stays low for most requests and climbs steeply at the end, "
            f"to {sim.seconds_text(stats['max'])} s for the slowest. A dashed line marks the average, {sim.seconds_text(stats['average'])} s, and dots mark {shown}.")
    return frame(600, 400, f"Sorted total times: average {sim.seconds_text(stats['average'])} s, p99 {sim.seconds_text(stats['p99'])} s", desc, body)


# --- figure 2: the wait before the first word at three loads --------------------------------------------------------------------

FIG2_RATES = (12, 17, 19)


def fig_loads() -> str:
    swept = sim.sweep(rates=list(FIG2_RATES))
    x0, scale, bar_h, row = 140, 80, 22, 32
    rows = (("Average", "average"), ("p50", "p50"), ("p95", "p95"), ("p99", "p99"))
    styles = {"average": f'fill="{ORANGE}"', "p50": f'fill="{FILL}" stroke="{INK}" stroke-width="2"', "p95": f'fill="{GREEN}"', "p99": f'fill="{INK}"'}
    body, y = [], 20
    for rate in FIG2_RATES:
        stats = swept[rate]["wait"]
        body.append(text(20, y + 24, f"{rate} requests a second", bold=True))
        y += 40
        body.append(f'<path d="M{x0} {y - 4}V{y + row * len(rows) - 4}" stroke="{GREY}" stroke-width="2"/>')
        for label, key in rows:
            width = max(stats[key] * scale, 3.0)
            body.append(text(20, y + 18, label, color=INK))
            body.append(f'<rect x="{x0}" y="{y}" width="{num(width)}" height="{bar_h}" {styles[key]}/>')
            body.append(text(x0 + width + 10, y + 18, f"{sim.seconds_text(stats[key])} s"))
            y += row
        y += 22
    desc = "Wait before the first word for the average, p50, p95 and p99. " + " ".join(
        f"At {rate} requests a second: " + ", ".join(f"{label.lower() if key == 'average' else label} {sim.seconds_text(swept[rate]['wait'][key])} s" for label, key in rows) + "."
        for rate in FIG2_RATES)
    return frame(600, y - 6, "Wait before the first word at 12, 17 and 19 requests a second", desc, body)


# --- figure 3: the chance a session meets a slow request ------------------------------------------------------------------------

SESSION_SIZES = (1, 10, 20)


def fig_session() -> str:
    x0, scale, bar_h, row = 180, 380, 30, 56
    body = [text(20, 34, "Chance of at least one wait above p95", bold=True)]
    for tick in (0, 50, 100):
        x = x0 + tick / 100 * scale
        body.append(f'<path d="M{num(x)} 62V{62 + row * len(SESSION_SIZES)}" stroke="{FILL}" stroke-width="2"/>')
        body.append(text(x, 62 + row * len(SESSION_SIZES) + 26, f"{tick}%", "middle", GREY, size=20))
    y = 76
    for k in SESSION_SIZES:
        chance = sim.session_chance(0.05, k)
        body.append(text(20, y + 23, f"{k} request" + ("" if k == 1 else "s")))
        body.append(f'<rect x="{x0}" y="{y}" width="{num(chance * scale)}" height="{bar_h}" fill="{GREEN}" stroke="{INK}" stroke-width="2"/>')
        body.append(text(x0 + chance * scale + 10, y + 23, f"{chance * 100:.0f}%", bold=True))
        y += row
    body.append(text(20, y + 52, "Assumes each wait is independent.", color=GREY))
    desc = ("Horizontal bars of the chance that a session meets at least one request slower than p95, when 1 request in 20 is. "
            + ", ".join(f"{k} request{'s' if k > 1 else ''}: {sim.session_chance(0.05, k) * 100:.0f}%" for k in SESSION_SIZES) + ". It assumes that each wait is independent of the others.")
    return frame(600, y + 66, "Chance that a session meets a slow request: 5%, 40% and 64%", desc, body)


# --- figure 4: when each tester sent its requests during a freeze ----------------------------------------------------------------

WINDOW = (36.0, 50.0)


def fig_testers() -> str:
    runs = {"schedule": sim.serve(sim.WORKLOAD, sim.DEMO_RATE, 0, sim.PAUSE), "waits": sim.serve(sim.WORKLOAD, sim.DEMO_RATE, sim.CONNECTIONS, sim.PAUSE)}
    demo = sim.generator_demo()
    x0, x1 = 20, 520
    px = lambda t: x0 + (t - WINDOW[0]) / (WINDOW[1] - WINDOW[0]) * (x1 - x0)
    freeze = (px(sim.PAUSE_AT), px(sim.PAUSE_AT + sim.PAUSE))
    rows = (("Sends on schedule", "schedule", "on schedule"), ("Waits for each reply", "waits", "waits for each reply"))
    body, y, facts = [], 30, []
    for label, key, demo_key in rows:
        sent = runs[key].sent
        inside = sum(1 for s in sent if sim.PAUSE_AT <= s < sim.PAUSE_AT + sim.PAUSE)
        facts.append((inside, demo[demo_key]["wait"]["p99"]))
        body.append(text(x0, y, label, bold=True))
        body.append(f'<rect x="{num(freeze[0])}" y="{y + 12}" width="{num(freeze[1] - freeze[0])}" height="48" fill="{PANEL}" stroke="{GREY}" stroke-width="2" stroke-dasharray="6 5"/>')
        ticks = "".join(f"M{num(px(s))} {y + 18}v36" for s in sent if WINDOW[0] <= s <= WINDOW[1])
        body.append(f'<path d="{ticks}" stroke="{INK}" stroke-width="1.6" fill="none"/>')
        body.append(text(x0, y + 90, f"{inside} sent in the freeze, p99 wait {sim.seconds_text(demo[demo_key]['wait']['p99'])} s"))
        y += 134
    axis = y - 18
    body.append(f'<path d="M{x0} {axis}H{x1}" stroke="{GREY}" stroke-width="2"/>')
    for t in (WINDOW[0], sim.PAUSE_AT, sim.PAUSE_AT + sim.PAUSE, WINDOW[1]):
        body.append(f'<path d="M{num(px(t))} {axis}v8" stroke="{GREY}" stroke-width="2"/>')
        body.append(text(px(t), axis + 32, f"{t:g} s", "middle", GREY, size=20))
    body.append(text((freeze[0] + freeze[1]) / 2, axis + 66, f"server frozen {sim.PAUSE:g} s", "middle"))
    desc = (f"Each short line is one request sent between {WINDOW[0]:g} and {WINDOW[1]:g} seconds, at {sim.DEMO_RATE} requests a second, while the toy server is frozen from "
            f"{sim.PAUSE_AT:g} to {sim.PAUSE_AT + sim.PAUSE:g} seconds. The tester that sends on schedule keeps sending: {facts[0][0]} requests go out in the freeze and the p99 wait is "
            f"{sim.seconds_text(facts[0][1])} s. The tester that waits for each reply nearly stops: {facts[1][0]} go out and the p99 wait is {sim.seconds_text(facts[1][1])} s.")
    return frame(540, axis + 82, "Two testers during a 5 second freeze", desc, body)


FIGURES = {
    "sorted-total-times.svg": fig_sorted,
    "wait-at-three-loads.svg": fig_loads,
    "session-chance.svg": fig_session,
    "two-testers.svg": fig_testers,
}


def main() -> int:
    stale = []
    for name, draw in FIGURES.items():
        path, svg = FIGS / name, draw()
        if "--check" in sys.argv:
            if not path.exists() or path.read_text(encoding="utf-8") != svg:
                stale.append(name)
        else:
            FIGS.mkdir(exist_ok=True)
            path.write_text(svg, encoding="utf-8")
    if "--check" in sys.argv:
        print("figures differ from tail_sim.py: " + ", ".join(stale) if stale else "figures match tail_sim.py")
        return 1 if stale else 0
    print("wrote " + ", ".join(FIGURES))
    return 0


if __name__ == "__main__":
sys.exit(main())Show code
"""Print every number the lesson quotes. Run: python3 show_numbers.py"""
import tail_sim as sim


def row(name: str, stats: dict) -> str:
    return f"{name:>8} | " + " | ".join(f"{sim.seconds_text(stats[k]):>7}" for k in ("average", "p50", "p95", "p99", "max"))


def main() -> None:
    w = sim.WORKLOAD
    n = len(w["gaps"])
    long_replies = sum(1 for r in w["replies"] if r >= sim.LONG_REPLY[0])
    print(f"{n} requests (seed {sim.SEED}); prompts {min(w['prompts'])} to {max(w['prompts'])} tokens; replies {min(w['replies'])} to {max(w['replies'])} tokens, "
          f"{long_replies} of {n} long (100 or more); mean reply {sim.mean(w['replies']):.1f} tokens; {sim.SLOTS} slots; "
          f"capacity {sim.capacity():.3f} requests a second")
    print()
    swept = sim.sweep()
    for measure in ("total", "wait"):
        print(f"{measure} time in seconds, on-schedule tester (columns: average, p50, p95, p99, slowest)")
        for rate in sim.RATES:
            print(row(f"{rate}/s", swept[rate][measure]))
        print()
    opening = swept[sim.OPENING_RATE]["total"]
    print("opening widget line:", sim.headline(opening, "total"))
    print("opening widget key:", sim.key_rows(opening))
    print()
    run = sim.serve(w, sim.OPENING_RATE)
    times = sim.totals(run)
    avg = sim.mean(times)
    print(f"at {sim.OPENING_RATE}/s total time: {sum(1 for t in times if t > avg)} of {n} requests take longer than the average; "
          f"{sum(1 for t in times if t <= avg)} take the average or less; "
          f"{sum(1 for t in times if t > sim.percentile(times, 95))} take more than p95; {sum(1 for t in times if t > sim.percentile(times, 99))} take more than p99")
    print()
    print("session chance (slow share, requests): 1 - (1 - share)^requests, independent waits")
    for share, k in ((0.05, 1), (0.05, 10), (0.05, 20), (0.01, 100)):
        print(f"  {share:.2f}, {k:3}: {sim.session_chance(share, k):.4f}")
    print()
    demo = sim.generator_demo()
    print(f"two testers, {sim.DEMO_RATE} requests a second, a {sim.PAUSE:g} s freeze at {sim.PAUSE_AT:g} s, {sim.CONNECTIONS} connections for the waiting tester")
    for name, result in demo.items():
        print(f"  {name}:")
        print("   wait  ", row("", result["wait"]).strip())
        print("   total ", row("", result["total"]).strip())
        print(f"   requests that waited over {sim.SLOW_WAIT:g} s for the first word: {result['slow']}")
    schedule = sim.serve(w, sim.DEMO_RATE, 0, sim.PAUSE)
    waiting = sim.serve(w, sim.DEMO_RATE, sim.CONNECTIONS, sim.PAUSE)
    late = lambda r: sum(1 for s, i in zip(r.sent, r.intended) if s > i)
    calm = late(sim.serve(w, sim.DEMO_RATE, sim.CONNECTIONS))
    print(f"  the waiting tester sent {late(waiting)} of {n} requests later than meant with the freeze and {calm} without it, so the freeze adds {late(waiting) - calm}; "
          f"the last request went at {max(waiting.sent):.1f} s against {max(schedule.sent):.1f} s")
    print(f"  requests sent while the server was frozen ({sim.PAUSE_AT:g} to {sim.PAUSE_AT + sim.PAUSE:g} s): on schedule {sum(1 for s in schedule.sent if sim.PAUSE_AT <= s < sim.PAUSE_AT + sim.PAUSE)}, "
          f"waiting {sum(1 for s in waiting.sent if sim.PAUSE_AT <= s < sim.PAUSE_AT + sim.PAUSE)}")
    print()
    ex = sim.pooled_example()
    print(f"averaging p99s: two servers, {ex['requests']:,} requests each, wait before the first word; quiet p99 {ex['quiet_p99']:.4f}, busy p99 {ex['busy_p99']:.4f}, "
          f"average of the two {ex['averaged']:.4f}, p99 of all {2 * ex['requests']:,} {ex['pooled']:.4f}")
    print()
    spread = sim.shuffle_spread()
    print(f"over the widget's {len(sim.REROLLS)} shuffles at {sim.OPENING_RATE}/s, total time: average {sim.seconds_text(spread['average'][0])} to {sim.seconds_text(spread['average'][1])} s, "
          f"p99 {sim.seconds_text(spread['p99'][0])} to {sim.seconds_text(spread['p99'][1])} s")
    print()
    print("what a percentile rests on: requests slower than p99 among n samples (nearest rank)")
    for count in (50, 100, 101, 200, 1000, 2000):
        rank = -(-99 * count // 100)
        print(f"  n {count:5}: p99 is the value at rank {rank}; {count - rank} slower")


if __name__ == "__main__":
main()Show code
"""A toy AI server, a pile of requests and the numbers a test reports about them: lesson 27 (why-average-speed-is-misleading).

The server is the continuous-batching server of lesson 24 (how-an-ai-server-answers-many-people-at-once): 8 slots on one A100, step times from its
`step_seconds`. Everything runs inside this one Python process. There is no network code: the "load generator" is a list of send times and the
"server" is a loop over steps, so nothing here can be pointed at a real service.

Per request the run records two times: the wait before the first word (from send to the end of the step that reads its prompt) and the total
time (from send to the last word). `summarize` turns a list of such times into an average and the percentiles p50, p95 and p99.

The widget (../widget.html) repeats `serve` and `summarize` in JavaScript; test_widget.py runs both and compares them.
Python 3 standard library only.
"""
from __future__ import annotations

import heapq
import importlib.util
import math
import random
import sys
from collections import deque
from pathlib import Path
from typing import NamedTuple

# --- lesson 24's step time, loaded by path (a sibling lesson folder is not a package) --------------------------------

def _load_batching():
    path = Path(__file__).resolve().parent.parent.parent / "how-an-ai-server-answers-many-people-at-once" / "code" / "batching_sim.py"
    spec = importlib.util.spec_from_file_location("batching_sim_lesson24", path)
    module = importlib.util.module_from_spec(spec)
    sys.modules[spec.name] = module                                   # a dataclass looks its own module up by name
    keep, sys.dont_write_bytecode = sys.dont_write_bytecode, True
    try:
        spec.loader.exec_module(module)
    finally:
        sys.dont_write_bytecode = keep
    return module


batching = _load_batching()
step_seconds = batching.step_seconds

# --- the invented workload -----------------------------------------------------------------------------------------------
# A seeded draw, not a measurement. Prompts run from 30 to 600 tokens (equal steps on a log scale, as in lesson 24). Replies are a skewed mix:
# most are short (8 to 60 tokens) and 12 in 100 are long (100 to 400 tokens).

SEED = 2027
N_REQUESTS = 2000
SLOTS = 8
LONG_SHARE = 0.12
SHORT_REPLY, LONG_REPLY = (8, 60), (100, 400)
RATES = [4, 8, 12, 15, 17, 19]            # intended requests per second, the load slider's stops
OPENING_RATE = 17
CONNECTIONS = 8                           # the waiting tester keeps this many requests going, one per connection
PAUSE_AT, PAUSE = 40.0, 5.0               # the toy server freezes for PAUSE seconds in the first step that starts at or after PAUSE_AT seconds
PERCENTILES = (50, 95, 99)


def draw_workload(seed: int = SEED, n: int = N_REQUESTS) -> dict:
    """Gaps (seconds between requests at one request a second, rounded to 4 places so JavaScript reads the same doubles), prompts and replies."""
    rng = random.Random(seed)
    gaps = [round(rng.expovariate(1.0), 4) for _ in range(n)]
    prompts = [round(30 * (600 / 30) ** rng.random()) for _ in range(n)]
    long = [rng.random() < LONG_SHARE for _ in range(n)]
    where = [rng.random() for _ in range(n)]
    replies = []
    for is_long, x in zip(long, where):
        lo, hi = LONG_REPLY if is_long else SHORT_REPLY
        replies.append(round(lo * (hi / lo) ** x))
    return {"gaps": gaps, "prompts": prompts, "replies": replies}


WORKLOAD = draw_workload()


def draw_rerolls(seed: int = SEED + 1, count: int = 8, n: int = N_REQUESTS) -> list[tuple[int, int]]:
    """Index maps i -> (a*i + b) % n for the widget's "Shuffle" button: same requests, another order. The first is the identity.
    `a` is odd and not a multiple of 5, so it is coprime with 2000 and the map is a permutation."""
    assert n % 10 == 0
    rng = random.Random(seed)
    out = [(1, 0)]
    while len(out) < count:
        a = rng.randrange(3, n)
        if a % 2 and a % 5:
            out.append((a, rng.randrange(n)))
    return out


REROLLS = draw_rerolls()


def shuffled(workload: dict, a: int, b: int) -> dict:
    n = len(workload["gaps"])
    order = [(a * i + b) % n for i in range(n)]
    return {key: [values[j] for j in order] for key, values in workload.items()}


def intended_times(gaps: list[float], rate: float) -> list[float]:
    """When the tester means to send each request: random gaps that average 1/rate seconds. The first goes at time 0."""
    out, t = [], 0.0
    for gap in gaps:
        out.append(t)
        t += gap / rate
    return out


# --- the toy server ---------------------------------------------------------------------------------------------------------

class Served(NamedTuple):
    intended: list      # when the tester meant to send each request
    sent: list          # when it actually did
    first: list         # when the first word came out
    done: list          # when the last word came out
    steps: int


def serve(workload: dict, rate: float, connections: int = 0, pause: float = 0.0, slots: int = SLOTS) -> Served:
    """Send the requests to the toy server and run it one step at a time, with lesson 24's continuous batching: at the start of every step each empty
    slot takes the next waiting request; a joining prompt is read in the step it joins and its first word comes out at the end of that step.

    connections == 0: "on schedule". Every request is sent at its intended time, whatever the server is doing.
    connections == K: "waits for each reply". K connections; connection c owns requests c, c+K, c+2K, ... and sends the next one when the previous
    reply is complete or at its intended time, whichever is later.
    pause > 0: the server freezes for `pause` seconds in the first step that starts at or after PAUSE_AT."""
    prompts, replies, n = workload["prompts"], workload["replies"], len(workload["gaps"])
    intended = intended_times(workload["gaps"], rate)
    sent, first, done = [0.0] * n, [0.0] * n, [0.0] * n
    ahead = [(intended[i], i) for i in range(n if connections == 0 else min(connections, n))]    # (send time, id), a heap
    heapq.heapify(ahead)
    held, made, waiting = [-1] * slots, [0] * n, deque()
    now, finished, steps, frozen = 0.0, 0, 0, False
    while finished < n:
        if not waiting and all(h < 0 for h in held) and ahead[0][0] > now:
            now = ahead[0][0]                                         # nothing is running: wait for the next request
        while ahead and ahead[0][0] <= now:
            when, i = heapq.heappop(ahead)
            sent[i] = when
            waiting.append(i)
        joined = []
        for s in range(slots):
            if held[s] < 0 and waiting:
                held[s] = waiting.popleft()
                joined.append(held[s])
        writing = [h for h in held if h >= 0 and h not in joined]
        dt = step_seconds([prompts[i] + made[i] for i in writing], sum(prompts[i] for i in joined))
        if pause > 0 and not frozen and now >= PAUSE_AT:
            dt += pause
            frozen = True
        now += dt
        steps += 1
        for s, h in enumerate(held):
            if h < 0:
                continue
            made[h] += 1
            if h in joined:
                first[h] = now
            if made[h] == replies[h]:
                done[h] = now
                held[s] = -1
                finished += 1
                follow = h + connections
                if connections and follow < n:
                    heapq.heappush(ahead, (max(intended[follow], now), follow))
    return Served(intended, sent, first, done, steps)


def capacity(workload: dict = WORKLOAD) -> float:
    """Requests a second the toy server can finish: all requests wait at time 0 and the server never idles."""
    n = len(workload["gaps"])
    run = serve({**workload, "gaps": [0.0] * n}, 1.0)
    return n / max(run.done)


# --- the numbers a test reports ---------------------------------------------------------------------------------------------

def percentile(values: list[float], p: int) -> float:
    """Nearest rank: the smallest value that at least p in 100 of the values do not exceed, i.e. the value at rank ceil(p * n / 100) when sorted."""
    ordered = sorted(values)
    return ordered[-(-p * len(ordered) // 100) - 1]


def mean(values: list[float]) -> float:
    total = 0.0
    for v in values:
        total += v
    return total / len(values)


def summarize(values: list[float]) -> dict:
    return {"average": mean(values), **{f"p{p}": percentile(values, p) for p in PERCENTILES}, "max": max(values)}


def totals(run: Served) -> list[float]:
    """Total time per request: send to last word."""
    return [d - s for d, s in zip(run.done, run.sent)]


def waits(run: Served) -> list[float]:
    """Wait before the first word per request: send to first word."""
    return [f - s for f, s in zip(run.first, run.sent)]


MEASURES = {"total": totals, "wait": waits}


def sweep(workload: dict = WORKLOAD, rates: list = RATES) -> dict:
    """For each rate, the summary of both measures on an on-schedule run."""
    out = {}
    for rate in rates:
        run = serve(workload, rate)
        out[rate] = {name: summarize(measure(run)) for name, measure in MEASURES.items()}
    return out


def pooled_example(workload: dict = WORKLOAD) -> dict:
    """Two servers that each handled the same 2,000 requests, one at a quiet 4 a second and one at a busy 19 a second, measured by the wait before
    the first word. The average of their two p99s is not the p99 of all 4,000 requests together."""
    quiet = waits(serve(workload, 4))
    busy = waits(serve(workload, 19))
    p99s = [percentile(quiet, 99), percentile(busy, 99)]
    return {"requests": len(quiet), "quiet_p99": p99s[0], "busy_p99": p99s[1], "averaged": mean(p99s), "pooled": percentile(quiet + busy, 99)}


def shuffle_spread(rate: int = OPENING_RATE, workload: dict = WORKLOAD) -> dict:
    """Lowest and highest average and p99 total time over the widget's shuffles (REROLLS, the opening order included) at one load."""
    runs = [summarize(totals(serve(shuffled(workload, a, b), rate))) for a, b in REROLLS]
    return {key: (min(r[key] for r in runs), max(r[key] for r in runs)) for key in ("average", "p99")}


DEMO_RATE = 12            # the load of the two-testers comparison: well below capacity, so a pause is the only trouble
SLOW_WAIT = 1.0           # seconds; a wait before the first word above this counts as slow in the comparison


def generator_demo(workload: dict = WORKLOAD) -> dict:
    """The same server and the same 5 s freeze, measured by two testers. For each: the summary of the wait before the first word and of the total
    time as that tester records them, and how many requests it saw waiting more than SLOW_WAIT seconds."""
    out = {}
    for name, connections in (("on schedule", 0), ("waits for each reply", CONNECTIONS)):
        run = serve(workload, DEMO_RATE, connections, PAUSE)
        wait = waits(run)
        out[name] = {"wait": summarize(wait), "total": summarize(totals(run)), "slow": sum(1 for w in wait if w > SLOW_WAIT)}
    return out


def session_chance(slow_share: float, requests: int) -> float:
    """Chance that a session of `requests` independent requests meets at least one that is slower than the cutoff, when `slow_share` of requests are."""
    return 1 - (1 - slow_share) ** requests


# --- the words the widget shows (widget.html repeats these in JavaScript; test_widget.py compares them) --------------------------

def seconds_text(s: float) -> str:
    return f"{s:.3f}" if s < 0.1 else f"{s:.2f}" if s < 10 else f"{s:.1f}"


def headline(stats: dict, measure: str) -> str:
    """The one line above the widget's chart: the average, then what 1 request in 20 and 1 in 100 meet."""
    avg, p95, p99 = (seconds_text(stats[k]) for k in ("average", "p95", "p99"))
    if measure == "total":
        return f"Average {avg} s. But 1 request in 20 takes more than {p95} s, and 1 in 100 more than {p99} s."
    return f"Average {avg} s. But 1 request in 20 waits more than {p95} s for its first word, and 1 in 100 more than {p99} s."


KEY_FIELDS = (("Average", "average"), ("p50", "p50"), ("p95", "p95"), ("p99", "p99"))


def key_rows(stats: dict) -> list[tuple[str, str]]:
    """The widget's key under the chart: name and value in seconds."""
return [(name, f"{seconds_text(stats[field])} s") for name, field in KEY_FIELDS]Show code
"""Guards for tail_sim.py: the toy server against lesson 24's, the percentile rule, the session chance, the two testers, and that the numbers the lesson
and its figures print are the ones the code gives."""
import ast
import re
from functools import lru_cache
from pathlib import Path

import numpy as np
import pytest

import make_figs
import tail_sim as sim

HERE = Path(__file__).resolve().parent
LESSON = HERE.parent
W = sim.WORKLOAD


@lru_cache(maxsize=None)
def run(rate, connections=0, pause=0.0):
    return sim.serve(W, rate, connections, pause)


@lru_cache(maxsize=None)
def swept():
    return sim.sweep()


def test_toy_server_gives_the_times_of_lesson_24_continuous_batching():
    """Guards the toy drifting from the scheduler lesson 24 explained: on schedule it must match that lesson's `simulate` for every request."""
    b = sim.batching
    for rate in (4, 12, 18):
        intended = sim.intended_times(W["gaps"], rate)
        reference = b.simulate([b.Request(t, p, r) for t, p, r in zip(intended, W["prompts"], W["replies"])], sim.SLOTS, "continuous")
        mine = run(rate)
        assert mine.first == reference.first_token and mine.done == reference.finished and mine.steps == len(reference.steps), rate


def test_nearest_rank_percentile_and_how_many_requests_a_p99_rests_on():
    """Guards an off-by-one in the percentile: p99 of 2,000 is the 1,980th time (20 slower), of 100 the 99th (1 slower), of 50 the slowest."""
    assert [sim.percentile(list(range(1, 101)), p) for p in (50, 95, 99)] == [50, 95, 99]
    assert sim.percentile(list(range(2000, 0, -1)), 99) == 1980                   # unsorted input
    assert sum(1 for v in range(1, 2001) if v > sim.percentile(list(range(1, 2001)), 99)) == 20
    assert sim.percentile(list(range(1, 51)), 99) == 50 and sim.percentile([7.0], 99) == 7.0
    assert sim.percentile([1, 2, 3, 4], 50) == 2                                  # nearest rank takes the lower of the two middle values
    times = sim.totals(run(sim.OPENING_RATE))                                     # NumPy's inverted_cdf is nearest rank; its default interpolates, and differs by under a thousandth here
    for p in sim.PERCENTILES:
        assert np.percentile(times, p, method="inverted_cdf") == sim.percentile(times, p)
        assert 0 < abs(np.percentile(times, p) - sim.percentile(times, p)) < 1e-3
    assert round(float(np.percentile(range(1, 51), 99)), 2) == 49.51 and sim.percentile(list(range(1, 51)), 99) == 50


def test_the_average_sits_between_the_median_and_p95_and_p99_grows_with_load():
    """Guards the lesson's central claim and the order of the numbers: p50 < average < p95 < p99 < max for both measures at every load, and the load stops stay below capacity."""
    assert sim.RATES[-1] < sim.capacity() < sim.RATES[-1] * 1.05
    for measure in ("total", "wait"):
        rows = [swept()[rate][measure] for rate in sim.RATES]
        for row in rows:
            assert row["p50"] < row["average"] < row["p95"] < row["p99"] < row["max"], (measure, row)
        for before, after in zip(rows, rows[1:]):
            assert after["p99"] > before["p99"] and after["average"] > before["average"]


def test_session_chance_is_one_minus_the_chance_of_missing_every_slow_request():
    """Guards the sum 10 x 5% = 50% (wrong) in place of 1 - 0.95^10 = 40.1%; the Tail at Scale's 63% for 100 servers at 1 in 100 is the same arithmetic."""
    assert round(sim.session_chance(0.05, 10), 4) == 0.4013 and round(sim.session_chance(0.05, 20), 4) == 0.6415
    assert round(sim.session_chance(0.01, 100), 2) == 0.63
    product = 1.0
    for _ in range(20):
        product *= 0.95
    assert sim.session_chance(0.05, 20) == pytest.approx(1 - product)
    assert sim.session_chance(0.05, 1) == pytest.approx(0.05) and sim.session_chance(0.0, 50) == 0.0


def test_a_tester_that_waits_for_replies_under_reports_the_stall():
    """Guards the lesson's second warning: with the same 5 s freeze at 12 a second, the tester that waits for each reply sees about 8 requests stuck and a
    p99 wait near the normal one, while the tester on schedule sees about a tenth of all requests wait over a second. Also: neither tester sends early,
    and the waiting one never has more than 8 requests out."""
    demo = sim.generator_demo()
    schedule, waits = demo["on schedule"], demo["waits for each reply"]
    assert schedule["wait"]["p99"] > 100 * waits["wait"]["p99"] and waits["wait"]["p99"] < 0.1 and waits["wait"]["max"] > sim.PAUSE - 0.5
    assert schedule["slow"] >= 100 and waits["slow"] <= 10
    for connections in (0, sim.CONNECTIONS):
        r = run(sim.DEMO_RATE, connections, sim.PAUSE)
        assert all(s >= i for s, i in zip(r.sent, r.intended))
        if connections:
            events = sorted([(s, 1) for s in r.sent] + [(d, -1) for d in r.done], key=lambda e: (e[0], e[1]))      # a reply that completes at time t frees its connection first
            out = peak = 0
            for _, delta in events:
                out += delta
                peak = max(peak, out)
            assert peak <= sim.CONNECTIONS
            assert all(r.sent[h + connections] >= r.done[h] for h in range(sim.N_REQUESTS - connections))


def test_averaging_two_p99s_is_not_the_p99_of_all_the_requests():
    """Guards the lesson's averaged-percentile example: two servers' p99s averaged give about half of what all 4,000 requests together give."""
    ex = sim.pooled_example()
    quiet, busy = sim.waits(run(4)), sim.waits(run(19))
    pooled = sorted(quiet + busy)[-(-99 * 4000 // 100) - 1]
    assert ex["pooled"] == pooled and ex["averaged"] == (ex["quiet_p99"] + ex["busy_p99"]) / 2 and ex["requests"] == 2000
    assert ex["averaged"] < 0.6 * ex["pooled"]
    assert sorted(quiet + busy)[-40:] == sorted(busy)[-40:]                       # the 40 slowest of the 4,000 all come from the busy server


def test_every_shuffle_is_the_same_requests_in_another_order():
    """Guards a shuffle map that repeats or drops a request: the widget's rerolls must be permutations of the 2,000 requests."""
    assert sim.REROLLS[0] == (1, 0) and len(set(sim.REROLLS)) == len(sim.REROLLS)
    for a, b in sim.REROLLS:
        mixed = sim.shuffled(W, a, b)
        assert sorted(mixed["prompts"]) == sorted(W["prompts"]) and sorted(mixed["replies"]) == sorted(W["replies"]) and sorted(mixed["gaps"]) == sorted(W["gaps"])
    assert sim.shuffled(W, 1, 0) == W


# The only modules this folder imports. None of them reaches a network, so a module that is not on the list (socketserver, xmlrpc, a new HTTP library) fails
# the test until someone adds it here on purpose. subprocess is handled apart: tests may import it.
IMPORTS = {"__future__", "ast", "collections", "functools", "heapq", "importlib", "json", "math", "numpy", "pathlib", "pytest", "random", "re", "sys", "typing", "xml"}
CALLS = {"urlopen", "connect", "system", "popen", "__import__", "import_module"}


def test_the_code_asks_nothing_of_the_network():
    """Guards the hard rule of this lesson: a load generator that only exists inside this process. No code file, the tests included, imports a module outside
    IMPORTS or calls one that reaches a network, a shell or an import by name; the one subprocess call allowed is `subprocess.run(["node", ...])` in a test, which
    test_widget.py uses to run the widget's own script. Each failure is a sentence that names the file, what it found and the rule."""
    own, found = {p.stem for p in HERE.glob("*.py")}, []
    for path in sorted(HERE.glob("*.py")):
        is_test = path.name.startswith("test_")
        tree = ast.parse(path.read_text(encoding="utf-8"))
        aliases = {a.asname or a.name for n in ast.walk(tree) if isinstance(n, ast.Import) for a in n.names if a.name == "subprocess"}      # `import subprocess as sp` too
        for node in ast.walk(tree):
            if isinstance(node, (ast.Import, ast.ImportFrom)):
                for module in [a.name for a in node.names] if isinstance(node, ast.Import) else [node.module or ""]:
                    root = module.split(".")[0]
                    if not (root in IMPORTS | own or (root == "subprocess" and is_test and isinstance(node, ast.Import))):
                        found.append(f"{path.name} imports {module or 'a relative module'}, but only the modules in IMPORTS may be imported here, and subprocess only in a test.")
            elif isinstance(node, ast.Call):
                f = node.func
                name = f.attr if isinstance(f, ast.Attribute) else f.id if isinstance(f, ast.Name) else ""
                if isinstance(f, ast.Attribute) and isinstance(f.value, ast.Name) and f.value.id in aliases:
                    program = node.args[0].elts[0] if node.args and isinstance(node.args[0], ast.List) and node.args[0].elts else None
                    if not (is_test and name == "run" and isinstance(program, ast.Constant) and program.value == "node"):
                        found.append(f"{path.name} calls subprocess.{name}(), but only subprocess.run([\"node\", ...]) is allowed, in a test.")
                elif name in CALLS:
                    found.append(f"{path.name} calls {name}(), which reaches a network, a shell or an import by name; only subprocess.run([\"node\", ...]) is allowed, in a test.")
            elif isinstance(node, ast.Constant) and isinstance(node.value, str) and not is_test and re.search(r"https?://", node.value):      # the tests name URLs in their lists of banned words
                found.append(f"{path.name} contains the URL text {node.value[:40]!r}, but only a test may name a URL, in its list of banned words.")
    assert not found, "network or process code in the lesson folder:\n  " + "\n  ".join(found)


def fragments():
    """Every number the lesson text quotes, as the text writes it, computed from the code."""
    f, S = sim.seconds_text, swept()
    total, wait = S[17]["total"], S[17]["wait"]
    times = sim.totals(run(17))
    above = sum(1 for v in times if v > total["average"])
    ex, demo, spread = sim.pooled_example(), sim.generator_demo(), sim.shuffle_spread()
    schedule, waits = demo["on schedule"], demo["waits for each reply"]
    waiting = run(12, sim.CONNECTIONS, sim.PAUSE)
    late = lambda r: sum(1 for s, i in zip(r.sent, r.intended) if s > i)
    froze = lambda r: sum(1 for s in r.sent if sim.PAUSE_AT <= s < sim.PAUSE_AT + sim.PAUSE)
    shoppers = [1] * 8 + [16] * 2
    out = [
        f"takes {f(total['average'])} seconds (s) on average, yet 1 request in 20 takes more than {f(total['p95'])} s and 1 in 100 more than {f(total['p99'])} s",
        f"Eight wait 1 minute and two wait 16, so the average is {sim.mean(shoppers):g} minutes", f"the 5th of 10 sorted, which is {sim.percentile(shoppers, 50)} minute",
        f"near {sim.capacity():.1f}", f"the total time averages {f(total['average'])} s, but p95 is {f(total['p95'])} s and p99 is {f(total['p99'])} s",
        f"{len(times) - above:,} of the {len(times):,} requests take the average of {f(total['average'])} s or less and {above:,} take longer",
        f"{sum(1 for r in W['replies'] if r >= sim.LONG_REPLY[0])} of the {len(times):,} are long, {sim.LONG_REPLY[0]} tokens or more, against at most {sim.SHORT_REPLY[1]}",
        f"p50 {f(total['p50'])} s", f"slowest {f(total['max'])} s",
        f"{100 * sim.session_chance(0.05, 10):.0f}%", f"{100 * sim.session_chance(0.05, 20):.0f}%",
        f"{100 * sim.session_chance(0.05, 10):.1f}% for 10 and {100 * sim.session_chance(0.05, 20):.1f}% for 20", f"which is {100 * sim.session_chance(0.01, 100):.1f}%",
        f"and the p99 wait is {f(wait['p99'])} s, against {f(total['average'])} s and {f(total['p99'])} s for the total",
        f"average wait is {f(wait['average'])} s",
        f"p99 wait is {f(S[4]['wait']['p99'])} s at 4 a second and {f(S[19]['wait']['p99'])} s at 19",
        f"At 12 requests a second the average is {f(S[12]['wait']['average'])} s, p95 is {f(S[12]['wait']['p95'])} s and p99 is {f(S[12]['wait']['p99'])} s",
        f"At 19 the average is {f(S[19]['wait']['average'])} s and p99 is {f(S[19]['wait']['p99'])} s",
        f"from {f(S[4]['wait']['p50'])} to {f(S[12]['wait']['p50'])} s, while the p99 rises from {f(S[4]['wait']['p99'])} to {f(S[12]['wait']['p99'])} s",
        f"an average of {f(S[12]['wait']['average'])} s looks healthy while 1 request in 20 already waits more than {f(S[12]['wait']['p95'])} s",
        f"the p99 wait is {f(schedule['wait']['p99'])} s for a tester on schedule and {f(waits['wait']['p99'])} s for one that waits",
        f"{f(S[4]['wait']['p99'])} s and {f(S[19]['wait']['p99'])} s average to {f(ex['averaged'])} s, but all {2 * ex['requests']:,} requests together have a p99 of {f(ex['pooled'])} s",
        f"passes at {f(total['average'])} s while 1 request in 20 takes over {f(total['p95'])} s",
        f"Their p99 waits are {ex['quiet_p99']:.4f} s and {ex['busy_p99']:.4f} s, and the average of the two is {ex['averaged']:.4f} s", f"the p99 is {ex['pooled']:.4f} s",
        "The 40 slowest of the 4,000 all come from the busy server", f"a p99 of {f(S[4]['total']['p99'])} s",
        f"over its {len(sim.REROLLS)} orders at 17 a second the average total time runs from {f(spread['average'][0])} to {f(spread['average'][1])} s "
        f"and the p99 from {f(spread['p99'][0])} to {f(spread['p99'][1])} s",
        f"seed {sim.SEED}", f"prompts of {min(W['prompts'])} to {max(W['prompts'])} tokens and replies of {min(W['replies'])} to {max(W['replies'])}",
        f"| On schedule | {froze(run(12, 0, sim.PAUSE))} | {f(schedule['wait']['p99'])} s |", f"| Waiting | {froze(waiting)} | {f(waits['wait']['p99'])} s |",
        f"{waits['slow']} of its requests wait over {sim.SLOW_WAIT:g} s for the first word, against {schedule['slow']} for the tester on schedule",
        f"Only {froze(waiting)} requests go out in the freeze instead of {froze(run(12, 0, sim.PAUSE))}. Even with no freeze, {late(run(12, sim.CONNECTIONS)):,} of its "
        f"{sim.N_REQUESTS:,} requests go out later than planned, because the last reply on their connection is not yet complete at the planned time; "
        f"the freeze adds {late(waiting) - late(run(12, sim.CONNECTIONS)):,}, so {late(waiting):,} in all",
        f"Its one worst wait, {f(waits['wait']['max'])} s", f"the server freezes for {sim.PAUSE:g} s at {sim.PAUSE_AT:g} s", f"at {sim.DEMO_RATE} requests a second",
        f"here {sim.CONNECTIONS}, and each sends",
    ]
    for rate in sim.RATES:
        for measure in ("total", "wait"):
            s = S[rate][measure]
            out.append(f"| {rate} | " + " | ".join(f(s[k]) for k in ("average", "p99")) + " |")
    for n in (50, 100, 200, 1000, 2000):
        rank = sim.percentile(list(range(1, n + 1)), 99)
        out.append(f"| {n:,} | {rank:,} | {n - rank:,} |")
    return out


def test_the_lesson_and_its_figures_quote_the_numbers_the_code_gives():
    """Guards a stale page: when the seed, a constant or the server changes, every number the prose, tables and figures quote must change with it. One assert
    names every fragment that is missing, so a rerun does not have to be repeated for each. Also: the figures are the ones make_figs.py draws, and only the
    site's colours are in them (no blue, no vermillion)."""
    text = (LESSON / "lesson.md").read_text(encoding="utf-8")
    missing = [frag for frag in fragments() if frag not in text]
    for name, draw in make_figs.FIGURES.items():
        path = make_figs.FIGS / name
        if not path.exists() or path.read_text(encoding="utf-8") != draw():
            missing.append(f"figs/{name} differs from make_figs.py")
        elif f"figs/{name}" not in text:
            missing.append(f"lesson.md does not show figs/{name}")
    assert not missing, "missing from the lesson or its figures:\n  " + "\n  ".join(missing)
    allowed = {"#0a1626", "#44566b", "#b36200", "#00855f", "#d2dae4", "#ebf0f6", "#ffffff"}
    for path in sorted((LESSON / "figs").glob("*.svg")):
        colours = {c.lower() for c in re.findall(r"#[0-9a-fA-F]{6}\b", path.read_text(encoding="utf-8"))}
assert colours <= allowed, (path.name, colours - allowed)Show code
"""Guards for ../widget.html: its data block, its size and controls, that its JavaScript gives the same times and words as tail_sim.py for every setting,
and what a reader sees."""
import json
import re
import subprocess
from functools import lru_cache

import tail_sim as sim
from embed_widget import CONFIG_BLOCK, WIDGET, config, embed

HTML = WIDGET.read_text(encoding="utf-8")
ROOT = HTML[HTML.index('<div class="tl-root">'):HTML.index("<script")]
LOADS = sim.RATES
MEASURES = ("total", "wait")
# every load, tester and freeze on the first arrival order, then every arrival order at the opening load and at the hardest setting
SETTINGS = [(rate, waits, freeze, 0) for rate in LOADS for waits in (False, True) for freeze in (False, True)]
SETTINGS += [(sim.OPENING_RATE, False, False, k) for k in range(1, len(sim.REROLLS))] + [(LOADS[-1], True, True, k) for k in range(1, len(sim.REROLLS))]

# Reads the model out of the widget between its marker comments, runs it with Node, and compares every time, summary and line of words with the ones Python
# wrote into the fixture, bit for bit (the seconds are compared as exact numbers).
PARITY = r"""
import fs from 'node:fs';
const [fixture, widget] = process.argv.slice(2);
const fx = JSON.parse(fs.readFileSync(fixture, 'utf8'));
const html = fs.readFileSync(widget, 'utf8');
const cfg = JSON.parse(html.match(/<script type="application\/json" id="tl-config">([\s\S]*?)<\/script>/)[1]);
const js = html.slice(html.indexOf('/* ---------- the model ('), html.indexOf('/* ---------- display'));
const api = new Function('cfg', "'use strict';" + js + '; return {serve, shuffled, times, summarize, secondsText, headline, keyRows, stepSeconds};')(cfg);
const bad = [];
let checks = 0;
const same = (what, got, want) => { checks++; if (JSON.stringify(got) !== JSON.stringify(want)) bad.push([what, JSON.stringify(got).slice(0, 160), JSON.stringify(want).slice(0, 160)]); };
fx.cases.forEach((c) => {
  const what = [c.rate, c.waits ? 'waits' : 'schedule', c.freeze ? 'freeze' : 'calm', 'order ' + c.reroll].join('/');
  const [a, b] = cfg.rerolls[c.reroll];
  const run = api.serve(api.shuffled(a, b), c.rate, c.waits ? cfg.connections : 0, c.freeze ? cfg.pause : 0);
  same(what + ' intended', run.intended, c.intended);
  same(what + ' sent', run.sent, c.sent);
  same(what + ' first words', run.first, c.first);
  same(what + ' last words', run.done, c.done);
  ['total', 'wait'].forEach((m) => {
    const st = api.summarize(api.times(run, m));
    same(what + ' ' + m + ' summary', [st.average, st.p50, st.p95, st.p99, st.max], c.stats[m]);
    same(what + ' ' + m + ' headline', api.headline(st, m), c.headline[m]);
    same(what + ' ' + m + ' key', api.keyRows(st), c.key[m]);
  });
});
fx.words.forEach((w) => same('seconds ' + w[0], api.secondsText(w[0]), w[1]));
fx.ranks.forEach((r) => { const st = api.summarize(Array.from({ length: r.n }, (_, i) => r.n - i)); same('p50, p95, p99 and slowest of 1 to ' + r.n, [st.p50, st.p95, st.p99, st.max], r.want); });
same('cost of one step', [api.stepSeconds(0, 0, 100), api.stepSeconds(1, 1000, 0), api.stepSeconds(64, 64000, 0)], fx.steps);
console.log(JSON.stringify({ checks, bad: bad.slice(0, 4) }));
process.exit(bad.length ? 1 : 0);
"""

# Runs the page script against a small stand-in for the DOM, moves the slider, presses the buttons, changes the settings and reads back what a reader sees.
PAGE = r"""
import fs from 'node:fs';
const [widget, fixture] = process.argv.slice(2);
const html = fs.readFileSync(widget, 'utf8');
const fx = JSON.parse(fs.readFileSync(fixture, 'utf8'));
const config = html.match(/<script type="application\/json" id="tl-config">([\s\S]*?)<\/script>/)[1];
const code = html.match(/<script>([\s\S]*?)<\/script>/)[1];

function el(tag) {
  const e = { tag, listeners: {}, value: '', checked: false, attrs: {}, textContent: '', innerHTML: '' };
  e.setAttribute = (k, v) => { e.attrs[k] = v; };
  e.getAttribute = (k) => e.attrs[k];
  e.addEventListener = (type, f) => (e.listeners[type] = e.listeners[type] || []).push(f);
  return e;
}
function open() {
  const page = { root: el('html'), messages: [], parent: { other: true } };
  fx.ids.forEach((id) => { page[id] = el('x'); });
  page['tl-config'].textContent = config;
  page['tl-tester'].value = 'schedule';
  page['tl-load'].value = '0';
  const doc = { getElementById: (id) => page[id], documentElement: page.root };
  const win = { addEventListener: (type, f) => page.messages.push(f) };
  new Function('document', 'window', 'parent', code)(doc, win, page.parent);
  return page;
}
const fire = (e, type) => (e.listeners[type || 'click'] || []).forEach((f) => f({ target: e }));
const bad = [];
let checks = 0;
const want = (what, got, expected) => { checks++; if (JSON.stringify(got) !== JSON.stringify(expected)) bad.push([what, JSON.stringify(got).slice(0, 160), JSON.stringify(expected).slice(0, 160)]); };
function look(page, key, what) {                       // compares the page with one expected view
  const v = fx.views[key];
  want(what + ': load words', page['tl-rate'].textContent, v.rate);
  want(what + ': headline', page['tl-head'].textContent, v.head);
  want(what + ': key', page['tl-key'].innerHTML, v.key);
  want(what + ': pressed buttons', [page['tl-total'].attrs['aria-pressed'], page['tl-wait'].attrs['aria-pressed']], v.pressed);
  want(what + ': chart dots', (page['tl-chart'].innerHTML.match(/<circle class="tl-dot" cx="[\d.]+" cy="[\d.]+" r="6"\/>/g) || []), v.dots);
  want(what + ': average line', (page['tl-chart'].innerHTML.match(/<line class="tl-avg"[^>]*>/g) || []), v.avg);
  want(what + ': top label', (page['tl-chart'].innerHTML.match(/>([\d.]+ s, the slowest)</) || [])[1], v.top);
  want(what + ': 7 labels, clear of each other and inside the chart', labelProblems(page['tl-chart'].innerHTML), [7, []]);
}
const spoken = (page) => page['tl-live'].textContent;

// Where the chart's labels sit. There is no layout engine here, so each label's box is estimated from its text: the width is 0.65 of the font size for every
// character (the real glyphs average about 0.58, so the box is wider than the text), the height runs from one font size above the baseline to 0.3 below it.
// No two boxes may overlap, and every box must lie inside the view box.
const FONT = Number(html.match(/\.tl-root \.tl-t \{ font: \d+ (\d+)px/)[1]);
function labelProblems(markup) {
  const [W, H] = markup.match(/viewBox="0 0 (\d+) (\d+)"/).slice(1).map(Number);
  const boxes = [...markup.matchAll(/<text class="tl-t[^"]*"( text-anchor="end")? x="(-?[\d.]+)" y="(-?[\d.]+)">([^<]*)<\/text>/g)].map((m) => {
    const x = Number(m[2]), y = Number(m[3]), w = 0.65 * FONT * m[4].length;
    return { name: m[4], left: m[1] ? x - w : x, right: m[1] ? x : x + w, top: y - FONT, bottom: y + 0.3 * FONT };
  });
  const problems = [];
  boxes.forEach((a, i) => {
    if (a.left < 0 || a.right > W || a.top < 0 || a.bottom > H) problems.push(a.name + ' leaves the chart');
    boxes.slice(i + 1).forEach((b) => {
      if (Math.min(a.right, b.right) > Math.max(a.left, b.left) && Math.min(a.bottom, b.bottom) > Math.max(a.top, b.top)) problems.push(a.name + ' overlaps ' + b.name);
    });
  });
  return [boxes.length, problems];
}

const first = open();
look(first, fx.opening, 'opening state');
want('opening controls', [first['tl-load'].value, first['tl-load'].max, first['tl-tester'].value, first['tl-freeze'].checked], [String(fx.rates.indexOf(fx.openingRate)), String(fx.rates.length - 1), 'schedule', false]);
want('nothing spoken yet', spoken(first), '');
want('capacity line', first['tl-cap'].textContent, fx.capacityLine);
want('freeze label', first['tl-freeze-text'].textContent, fx.freezeLabel);
want('slider reads out', first['tl-load'].attrs['aria-valuetext'], fx.openingRate + ' requests a second');
const path = first['tl-chart'].innerHTML.match(/<path class="tl-area" d="([^"]*)"/)[1];
want('curve: 1 start, 200 steps, 2 closing lines, closed', [path.startsWith('M6.0 '), (path.match(/L/g) || []).length, path.endsWith('Z')], [true, 202, true]);
fx.openingDots.forEach((d) => want('dot ' + d + ' sits on the curve', path.includes('L' + d), true));

// every load stop, by dragging (input) and by releasing (change)
const slider = open();
fx.rates.forEach((rate, i) => {
  slider['tl-load'].value = String(i);
  const heard = spoken(slider);
  fire(slider['tl-load'], 'input');
  look(slider, 'load ' + rate, 'load ' + rate);
  want('dragging stays silent at ' + rate, spoken(slider), heard);
  fire(slider['tl-load'], 'change');
  want('release speaks at ' + rate, spoken(slider), fx.said['load ' + rate]);
});

// the measure buttons, at the opening load and at the highest load
const measure = open();
fire(measure['tl-wait']);
look(measure, 'wait', 'wait for the first word');
want('measure speaks', spoken(measure), fx.said.wait);
fire(measure['tl-total']);
look(measure, fx.opening, 'back to total time');
want('total speaks', spoken(measure), fx.said.total);

// the three settings under More settings, then all of them together
const more = open();
more['tl-tester'].value = 'waits'; fire(more['tl-tester'], 'change');
look(more, 'waits', 'tester waits'); want('tester speaks', spoken(more), fx.said.waits);
more['tl-tester'].value = 'schedule'; fire(more['tl-tester'], 'change');
look(more, fx.opening, 'tester back on schedule');
more['tl-freeze'].checked = true; fire(more['tl-freeze'], 'change');
look(more, 'freeze', 'freeze'); want('freeze speaks', spoken(more), fx.said.freeze);
more['tl-freeze'].checked = false; fire(more['tl-freeze'], 'change');
want('freeze off speaks', spoken(more), fx.said.calm);
fx.rerolls.forEach((r, k) => {
  fire(more['tl-shuffle']);
  look(more, 'order ' + (k + 1), 'shuffle ' + (k + 1));
  want('shuffle speaks ' + (k + 1), spoken(more), r);
});
// the crowded chart: wait for the first word, the tester that waits, the server frozen. p95 and p99 sit on one line here, at every load and in every arrival order
const crowded = open();
fire(crowded['tl-wait']);
crowded['tl-tester'].value = 'waits'; fire(crowded['tl-tester'], 'change');
crowded['tl-freeze'].checked = true; fire(crowded['tl-freeze'], 'change');
for (let k = 0; k < fx.rerolls.length; k++) {
  fx.rates.forEach((rate, i) => {
    crowded['tl-load'].value = String(i); fire(crowded['tl-load'], 'input');
    want('crowded chart, load ' + rate + ', order ' + (k + 1) + ': 7 labels, clear of each other and inside the chart', labelProblems(crowded['tl-chart'].innerHTML), [7, []]);
  });
  fire(crowded['tl-shuffle']);
}
const all = open();
all['tl-load'].value = String(fx.rates.length - 1); fire(all['tl-load'], 'input');
all['tl-tester'].value = 'waits'; fire(all['tl-tester'], 'change');
all['tl-freeze'].checked = true; fire(all['tl-freeze'], 'change');
fire(all['tl-wait']); fire(all['tl-shuffle']); fire(all['tl-shuffle']); fire(all['tl-shuffle']);
look(all, 'everything', 'every setting changed');

// the host page theme: only the parent window may set it, and only to light or dark
const themed = open();
const send = (data, source) => themed.messages.forEach((f) => f({ data, source }));
send({ type: 'spicyshark:theme', theme: 'dark' }, { other: false });
send({ type: 'spicyshark:theme', theme: 'purple' }, themed.parent);
send({ type: 'other', theme: 'dark' }, themed.parent);
send(null, themed.parent);
want('ignored messages', themed.root.attrs, {});
send({ type: 'spicyshark:theme', theme: 'dark' }, themed.parent);
want('theme from the parent', themed.root.attrs, { 'data-theme': 'dark' });
send({ type: 'spicyshark:theme', theme: 'light' }, themed.parent);
want('theme back to light', themed.root.attrs, { 'data-theme': 'light' });

console.log(JSON.stringify({ checks, bad: bad.slice(0, 5) }));
process.exit(bad.length ? 1 : 0);
"""

X0, X1, Y0, Y1 = 6, 314, 30, 166              # the chart's drawing box, as in widget.html


@lru_cache(maxsize=None)
def served(rate, waits, freeze, reroll):
    a, b = sim.REROLLS[reroll]
    return sim.serve(sim.shuffled(sim.WORKLOAD, a, b), rate, sim.CONNECTIONS if waits else 0, sim.PAUSE if freeze else 0.0)


def stats(rate, waits=False, freeze=False, reroll=0, measure="total"):
    return sim.summarize(sim.MEASURES[measure](served(rate, waits, freeze, reroll)))


def x(share):
    return f"{X0 + (X1 - X0) * share:.1f}"


def y(value, top):
    return f"{Y1 - (Y1 - Y0) * value / top:.1f}"


def view(rate, waits=False, freeze=False, reroll=0, measure="total"):
    """What the page should show after it has settled on these settings."""
    st = stats(rate, waits, freeze, reroll, measure)
    dots = [f'<circle class="tl-dot" cx="{x(s)}" cy="{y(st[k], st["max"])}" r="6"/>' for k, s in (("p50", 0.5), ("p95", 0.95), ("p99", 0.99))]
    line = y(st["average"], st["max"])
    key = "".join(f'<li><i{" class=" + chr(34) + "tl-sw-avg" + chr(34) if i == 0 else ""}></i><span>{name} {value}</span></li>' for i, (name, value) in enumerate(sim.key_rows(st)))
    return {"rate": str(rate), "head": sim.headline(st, measure), "key": key, "pressed": ["true", "false"] if measure == "total" else ["false", "true"], "dots": dots,
            "avg": [f'<line class="tl-avg" x1="{X0}" x2="{X1}" y1="{line}" y2="{line}"/>'], "top": f"{sim.seconds_text(st['max'])} s, the slowest"}


def spoken_line(rate, measure, head):
    return f"{rate} requests a second. {'Total time' if measure == 'total' else 'Wait for the first word'}. {head}"


def run_node(tmp_path, script, fixture, args):
    (tmp_path / "fixture.json").write_text(json.dumps(fixture), encoding="utf-8")
    (tmp_path / "check.mjs").write_text(script, encoding="utf-8")
    result = subprocess.run(["node", str(tmp_path / "check.mjs"), *args(tmp_path)], capture_output=True, text=True, timeout=300)
    assert result.returncode == 0, result.stdout + result.stderr
    return json.loads(result.stdout)


def test_widget_data_block_matches_the_python_constants():
    """Guards a constant edit that was not copied into the widget (run embed_widget.py)."""
    assert embed(HTML) == HTML


def test_embed_rewrites_a_widget_whose_data_block_drifted():
    """Guards embed() skipping the block: a hand-edited parameter count or a changed freeze length must be put back."""
    drifted = HTML.replace('"params": 8030261248', '"params": 7000000000', 1).replace('"pause": 5.0', '"pause": 50.0', 1)
    assert drifted != HTML and embed(drifted) == HTML
    assert json.loads(CONFIG_BLOCK.search(HTML).group(2)) == json.loads(json.dumps(config()))


def test_every_element_the_script_looks_up_exists_inside_the_root():
    """Guards a widget that never starts: the parity run covers only the model, so a misspelt id would pass there and throw in the browser."""
    script = HTML[HTML.index("<script>"):]
    lookups = set(re.findall(r"\$\('([\w-]+)'\)", script))
    missing = sorted(i for i in lookups if i != "tl-config" and f'id="{i}"' not in ROOT)
    assert not missing, missing
    assert 'id="tl-config"' in HTML and len(lookups) >= 12


def test_widget_is_small_and_asks_for_nothing_online():
    assert len(HTML.splitlines()) <= 300 and len(HTML.encode("utf-8")) < 60 * 1024
    page = CONFIG_BLOCK.sub("", HTML)
    for banned in ("http://", "https://", "fetch(", "XMLHttpRequest", "WebSocket", "sendBeacon", "import(", "<form", 'type="submit"'):
        assert banned not in page, banned
    assert " src=" not in page and "@import" not in page


def test_widget_shows_at_most_five_controls_and_hides_the_rest():
    """Guards the first screen at 390 px: the slider and the two measure buttons stay in view, and the other three controls wait in a closed details element."""
    outside = re.sub(r"<details>.*?</details>", "", ROOT, flags=re.S)
    assert len(re.findall(r"<(?:select|button|input|textarea)\b", outside)) == 3
    assert "<details><summary>More settings</summary>" in ROOT and "<details open" not in ROOT
    assert re.search(r'<details><summary>More settings</summary>.*?<select id="tl-tester">.*?<input type="checkbox" id="tl-freeze">.*?<button type="button" id="tl-shuffle">', ROOT, re.S)


def test_widget_keeps_the_site_theme_listener_and_palette():
    assert "d.type !== 'spicyshark:theme'" in HTML and "e.source !== parent" in HTML and "parent === window" in HTML
    for pair in ("--bg: light-dark(#ffffff, #0a0f17)", "--panel: light-dark(#ebf0f6, #131b28)", "--ink: light-dark(#0a1626, #f4f7fb)",
                 "--mute: light-dark(#44566b, #a3b1c4)", "--ctl: light-dark(#66768a, #7a8a9f)",
                 "--green: light-dark(#00855F, #009E73)", "--orange: light-dark(#b36200, #E69F00)", ":root[data-theme=light]", ":root[data-theme=dark]"):
        assert pair in HTML, pair
    for banned in ("#0072B2", "#56B4E9", "#D55E00"):
        assert banned.lower() not in HTML.lower()
    assert not set(re.findall(r"#[0-9a-fA-F]{3,8}\b", HTML)) - {"#ffffff", "#0a0f17", "#ebf0f6", "#131b28", "#0a1626", "#f4f7fb", "#44566b", "#a3b1c4",
                                                               "#66768a", "#7a8a9f", "#00855F", "#009E73", "#b36200", "#E69F00"}


def test_widget_model_gives_the_times_and_words_of_the_python_model(tmp_path):
    """Guards the widget's JavaScript drifting from tail_sim.py: the lesson prints Python's numbers and the reader sees the widget's, so the send, first-word and
    last-word time of all 2,000 requests, the five numbers and the lines of words must agree to the last bit at every load, tester and freeze, and in every arrival order."""
    cases = []
    for rate, waits, freeze, reroll in SETTINGS:
        run = served(rate, waits, freeze, reroll)
        st = {m: stats(rate, waits, freeze, reroll, m) for m in MEASURES}
        cases.append({"rate": rate, "waits": waits, "freeze": freeze, "reroll": reroll, "intended": run.intended, "sent": run.sent, "first": run.first, "done": run.done,
                      "stats": {m: [st[m][k] for k in ("average", "p50", "p95", "p99", "max")] for m in MEASURES},
                      "headline": {m: sim.headline(st[m], m) for m in MEASURES}, "key": {m: [list(r) for r in sim.key_rows(st[m])] for m in MEASURES}})
    b = sim.batching
    words = [[s, sim.seconds_text(s)] for s in (0.0, 0.0124, 0.0999, 0.1, 0.7406, 9.994, 10.0, 12.345, 123.456)]
    steps = [b.batch_step([], 100).seconds, b.batch_step([1000]).seconds, b.batch_step([1000] * 64).seconds]
    ranks = [{"n": n, "want": [sim.percentile(list(range(1, n + 1)), p) for p in (50, 95, 99)] + [n]} for n in (7, 50, 99, 100, 101, 150, 2000)]    # counts where p x n / 100 is not a whole number
    result = run_node(tmp_path, PARITY, {"cases": cases, "words": words, "steps": steps, "ranks": ranks}, lambda d: [str(d / "fixture.json"), str(WIDGET)])
    assert result["bad"] == [] and result["checks"] >= len(cases) * 10


def test_widget_page_shows_what_the_lesson_names(tmp_path):
    """Guards the part a reader sees: the opening state (17 a second, total time), every load stop, both measures, the three settings under More settings, the
    chart's dots and average line, what is spoken, the theme message, and the words that keep a toy from reading as a measurement."""
    outside = re.sub(r"<details>.*?</details>", "", ROOT, flags=re.S)
    assert "A toy server and 2,000 invented requests, not a measurement of a real service." in outside and sim.N_REQUESTS == 2000
    assert "p50, p95 and p99 are the times that 50, 95 and 99 of every 100 requests beat." in outside
    assert 'class="tl-sr" id="tl-live" role="status" aria-live="polite" aria-atomic="true"' in ROOT      # what a screen reader hears
    for rule in (".tl-root button { font: inherit; font-weight: 600; font-size: 0.9rem; line-height: 1.2; min-height: 44px; min-width: 72px; padding: 2px 10px; white-space: nowrap;",
                 ".tl-root label.tl-lab { display: block; font-weight: 600; white-space: nowrap; }", ".tl-root input[type=range] { display: block; width: 100%; height: 44px;",
                 ".tl-root li { display: flex; align-items: center; gap: 8px; white-space: nowrap; }", "paint-order: stroke; stroke: var(--bg); stroke-width: 7px;"):      # one line at 290 px, 44 px taps, labels clear of the lines
        assert rule in HTML, rule
    assert 'aria-pressed="true">Total time</button>' in outside and 'aria-pressed="false">Wait for first word</button>' in outside
    assert '<option value="schedule">Sends on schedule</option><option value="waits">Waits for each reply before sending</option>' in ROOT
    views = {"opening": view(sim.OPENING_RATE), "wait": view(sim.OPENING_RATE, measure="wait"), "waits": view(sim.OPENING_RATE, waits=True),
             "freeze": view(sim.OPENING_RATE, freeze=True), "everything": view(LOADS[-1], waits=True, freeze=True, reroll=3, measure="wait")}
    said = {"wait": spoken_line(sim.OPENING_RATE, "wait", views["wait"]["head"]), "total": spoken_line(sim.OPENING_RATE, "total", views["opening"]["head"]),
            "waits": "The tester waits for each reply. " + views["waits"]["head"], "freeze": f"Server frozen for {sim.PAUSE:g} seconds. " + views["freeze"]["head"],
            "calm": "No freeze. " + views["opening"]["head"]}
    for rate in LOADS:
        views[f"load {rate}"] = view(rate)
        said[f"load {rate}"] = spoken_line(rate, "total", views[f"load {rate}"]["head"])
    rerolls = []
    for k in range(1, len(sim.REROLLS) + 1):
        views[f"order {k}"] = view(sim.OPENING_RATE, reroll=k % len(sim.REROLLS))
        rerolls.append(f"Requests shuffled, set {k % len(sim.REROLLS) + 1} of {len(sim.REROLLS)}. {views[f'order {k}']['head']}")
    opening_stats = stats(sim.OPENING_RATE)
    ids = sorted(set(re.findall(r'id="(tl-[\w-]+)"', HTML)))
    fixture = {"ids": ids, "views": views, "opening": "opening", "openingRate": sim.OPENING_RATE, "rates": LOADS, "said": said, "rerolls": rerolls,
               "capacityLine": f"This server tops out near {round(sim.capacity(), 1)} a second.", "freezeLabel": f"Freeze the server for {sim.PAUSE:g} seconds",
               "openingDots": [f"{x(s)} {y(opening_stats[k], opening_stats['max'])}" for k, s in (("p50", 0.5), ("p95", 0.95), ("p99", 0.99))]}
    result = run_node(tmp_path, PAGE, fixture, lambda d: [str(WIDGET), str(d / "fixture.json")])
    assert result["bad"] == [] and result["checks"] > 100